En mis cursos de PowerBI, uno de los temas que presentan más dificultades y sorpresas en los participantes es comprender qué es el contexto de evaluación, qué es el contexto de fila, el contexto de filtro, y sobre todo, la transferencia de contextos.
Microsoft, como es habitual en sus productos para uso masivo, oculta las complejidades internas para “facilitar” el uso de su producto. Y eso está bien para resolver los casos más simples. Pero para los casos reales, que nunca son tan simples, si no entiendes en profundidad qué es lo que hacen las inocentes funciones como CALCULATE, te aparecen sorpresas insalvables 🙁
A modo de ejemplo, voy a calcular un simple ranking, a partir de una tabla de 500 registros, con dos columnas: id y val
id toma valores enteros de 0 a 9
val toma valores enteros 1 y 35
Aquí tienes un script de M para crear los datos de este ejemplo. El nombre de la consulta y la tabla resultante es ‘datos’
Nota: Al final de este blog pondré un enlace para que puedas descargar el fichero de ejemplo.
let
Origen = {1..500},
p_01 = Table.FromList(Origen, Splitter.SplitByNothing(), null, null, ExtraValues.Error),
p_02 = Table.DuplicateColumn(p_01″, “Column1”, “Column1 – Copia”),
p_03 = Table.TransformColumnTypes(p_02″,{{“Column1 – Copia”, Int64.Type}}),
p_04 = Table.TransformColumns(p_03″,{{“Column1 – Copia”, each Number.Mod(, 2), Int64.Type}}), p_05 = Table.DuplicateColumn(p_04″, “Column1”, “Column1 – Copia.1″), p_06 = Table.TransformColumns(p_05”,{{“Column1 – Copia.1”, each Number.Mod(, 10), type number}}),
p_07 = Table.RenameColumns(p_06″,{{“Column1”, “i”}, {“Column1 – Copia”, “p”}, {“Column1 – Copia.1”, “id”}}),
p_08 = Table.ReorderColumns(p_07″,{“id”, “i”, “p”}),
p_09 = Table.AddColumn(p_08″, “Personalizado”, each [p] + Number.Sqrt([i]) + ([p]*[id])),
p_10 = Table.SelectColumns(p_09″,{“id”, “Personalizado”}),
p_11 = Table.RenameColumns(p_10″,{{“Personalizado”, “val”}}),
p_12 = Table.TransformColumnTypes(p_11″,{{“val”, type number}, {“id”, Int64.Type}}),
final = Table.TransformColumnTypes(p_12″,{{“val”, Int64.Type}})
in
final
Una muestra de los datos, ya cargados en PowerBI:

Hacemos una medida para calcular la frecuencia de cada valor de la columna val
Freq = COUNTROWS(misDatos) // datos es el nombre de la tabla
Los campos disponibles ahora son
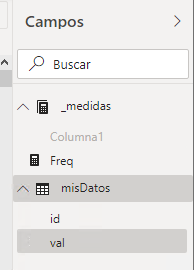
Las medidas, las pongo en una tabla falsa, con el nombre adecuado para que aparezca en primer lugar. Los campos de misDatos tienen resumen predefinido como “No resumir’
Expongo los resultados en un objeto visual Tabla
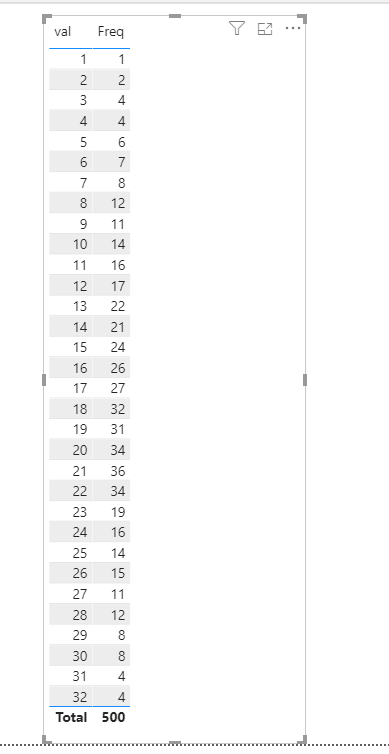
Verifico que la suma de Freq coincide con el número total de registros de misDatos 🙂
Veamos ahora el cálculo del ranking, usando funciones elementales como CALCULATE, VALUES, FILTER, ALL
Usando variables, primero calculo el valor de Freq para cada fila de esta tabla visual
Rk = var miFreq = [Freq]
var r = miFreq
return r
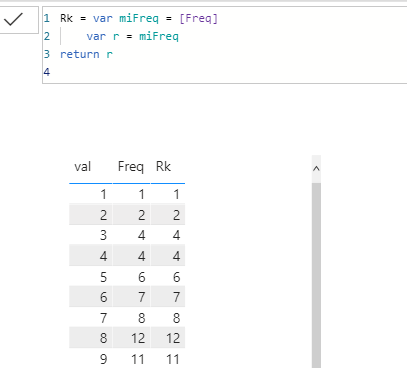
La medida Rk se evalúa en cada celda, es decir, con el contexto de filtro dado por el valor de val que corresponde a cada fila del visual. Tal como esperamos, su valor coincide con el de la columna Frec.
Para obtener un ranking, decimos que el primer lugar lo ocupa aquel valor cuya fila tiene el Freq más alto, es decir, que si cuento cuantos valores mayores que Freq hay, el resultado es 0. Si generalizo este criterio, diré que el ranking “PARA CADA VALOR DE val” es el numero que resulta de “contar valores” de “toda” la “columna que corresponde al campo val”, cuya Freq sea mayor que la de su propio valor. Como acostumbramos hacer rankings a partir del valor 1, y no del 0, tendremos que sumarle 1 a esta definición.
He puesto entre comillas palabras clave que usaremos para el cálculo.
Vemos que tendremos que considerar no solo la fila actual, sino todas las filas de la tabla visual.
La columna visual la podemos calcular con VALUES
Veamos:
Rk = var miFreq = [Freq]
var r = 1 + CALCULATE(
COUNTROWS(
VALUES(misDatos[val])
),
FILTER(
ALL(misDatos[val]),
[Freq] > miFreq
)
)
return r
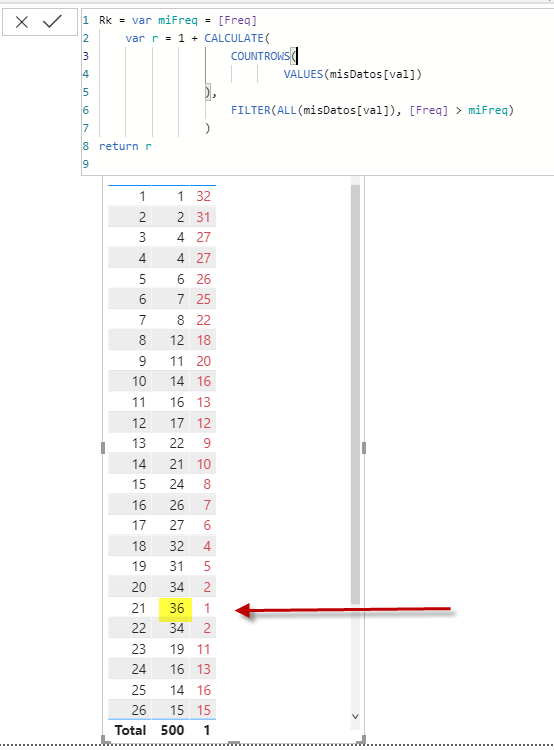
En la columna marcada en rojo vemos el ranking. en el cual en caso de frecuencias iguales (empates), todos ellos llevan el mismo número, y el siguiente valor de frecuencia, salta posiciones en forma correspondiente. Por ejemplo el valor val 20 y 22 tienen ambos frecuencia 34, y comparten la posición 2. La siguiente posición en el ranking será con posición 4º, para el valor 18 con frecuencia 32.
Tener en cuenta que hemos usado VALUES para generar un vector con cada uno de los valores de val. Lo podríamos haber hecho con la función DISTINCT, con igual resultado, ya que tenemos una sola tabla de origen. ¿Mismo valor aunque haya valores en blanco? Sí . Puedes leer más sobre este detalle aquí.
SI intentamos crear esta lista con una fórmula como SUMMARIZE, o SUMMARIZECOLUMNS, vemos que la función COUNTROWS no lo admite: requiere una definición de tabla, no una expresión de tabla. O dicho de otra forma, una función que no pueda contener una agregación (cálculo), sino solo basado en los datos presentes en el modelo de datos.
Otro detalle importante es que la tabla a iterar en FILTER, la defino como ALL(campo), y no como ALL(Tabla).
Cuando se evalúe la medida [Freq] = COUNTROWS(misDatos), sabemos que se realizará una transferencia de contexto desde el contexto de FILA al contexto de FILTRO. ALL(Tabla) definirá una máscara de filtrado para cada columna de la tabla, por lo que cada iteración contendrá un filtro tanto sobre el campo val, como sobre el campo id. Por lo tanto, el resultado del cálculo siempre estará basado sobre el recuento de filas donde coinciden ambos valores, un número mucho menor, y que no es el valor que buscamos.
Si quieres comentar sobre este artículo, por favor escríbeme a roberto@mirelman.com y agregaré tus comentarios aquí.